Dashboard
The dashboard is a single-page web app served by fleetd.js, a Node daemon
that runs on the same machine as your runners. Open
http://localhost:7878 after installing it.
For installation, see Get started → Install the dashboard.
The screenshots on this page are a fixture fleet
Every repository, host and runner name below is invented, and the numbers
come with them. They are the real interface rendering fixture data, so that
a screenshot of the Analytics tab cannot be mistaken for a measurement.
docs/tools/shoot-dash.mjs builds the fleet and captures them; the two
images in the README that are from a live fleet say so where they appear.
Tabs
Fleet
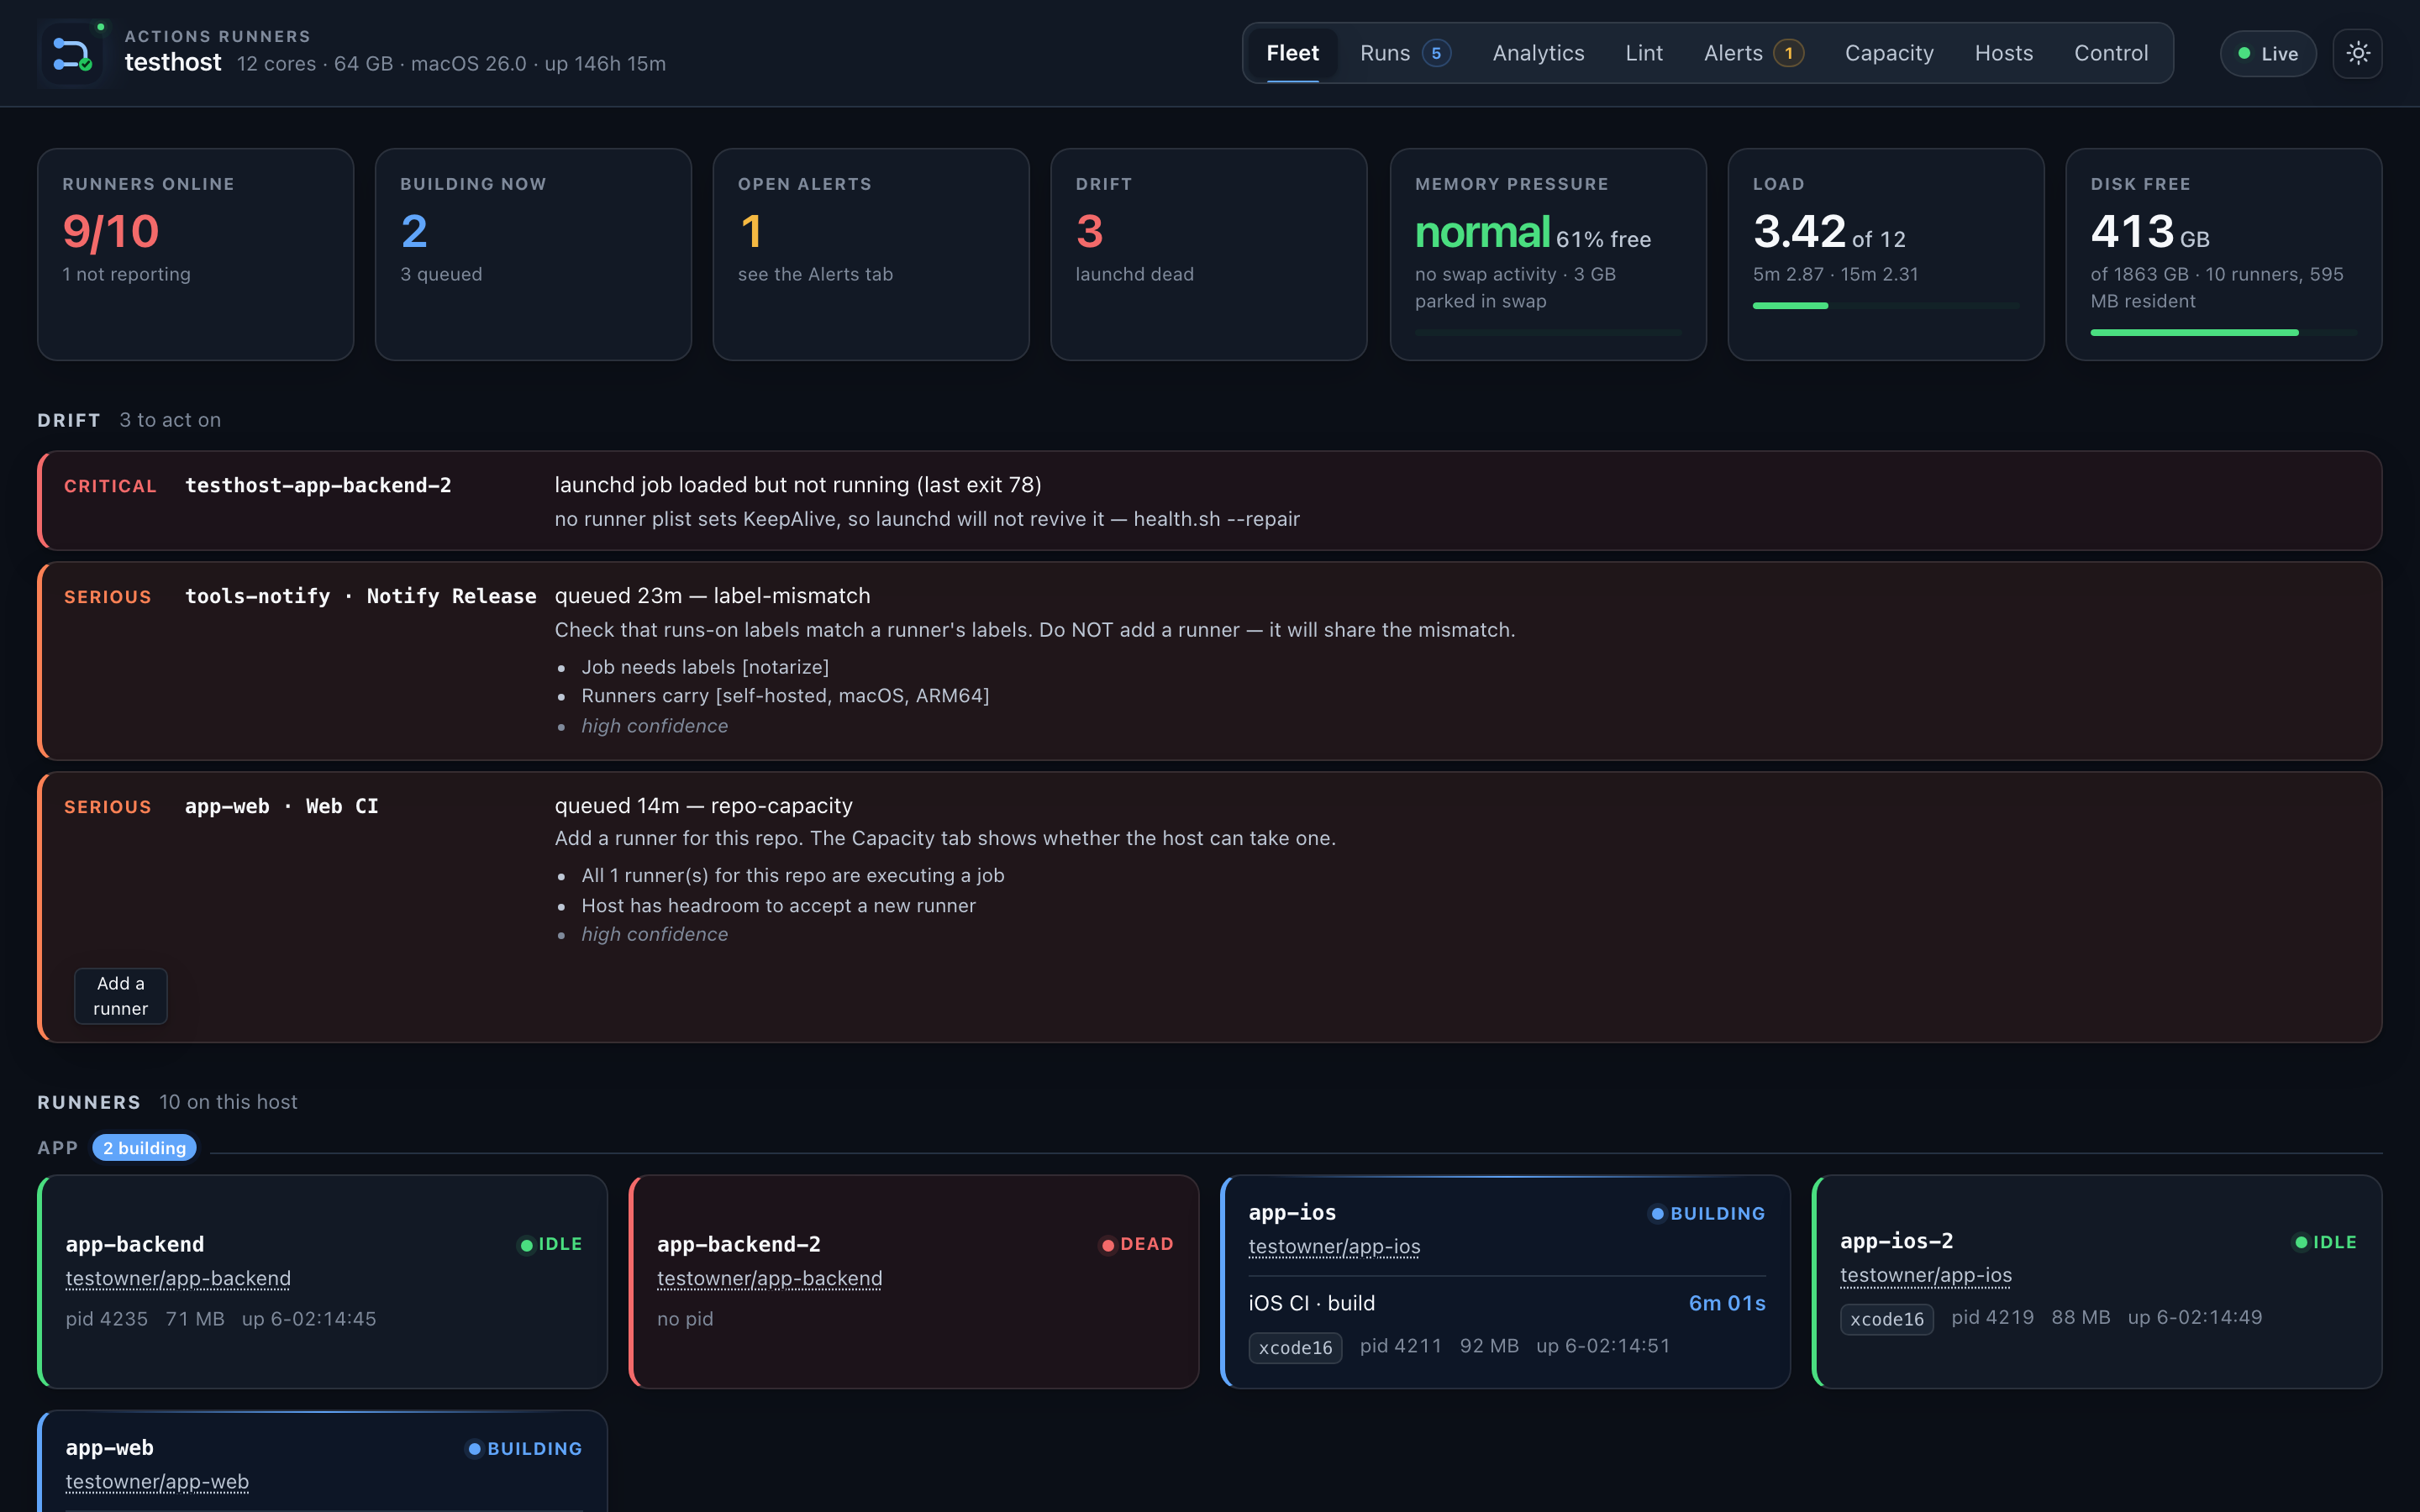
The main view. Shows every registered runner grouped by project, with live status badges.
Runner status badges:
| Badge | Meaning |
|---|---|
| busy | A job is running (Runner.Worker process detected) |
| online | Registered, service running, no active job |
| offline | Registered on GitHub but process not detected |
| draining | Scheduled to stop after its current job |
| drained | Stopped intentionally; will not take new jobs |
| dead | LaunchAgent loaded but process not running |
| not-loaded | LaunchAgent not loaded (or runner not registered) |
| unknown | GitHub API could not be reached for this runner |
Click any runner to open the runner drawer: recent events, job history, version info, diagnostic log summary, and action buttons.
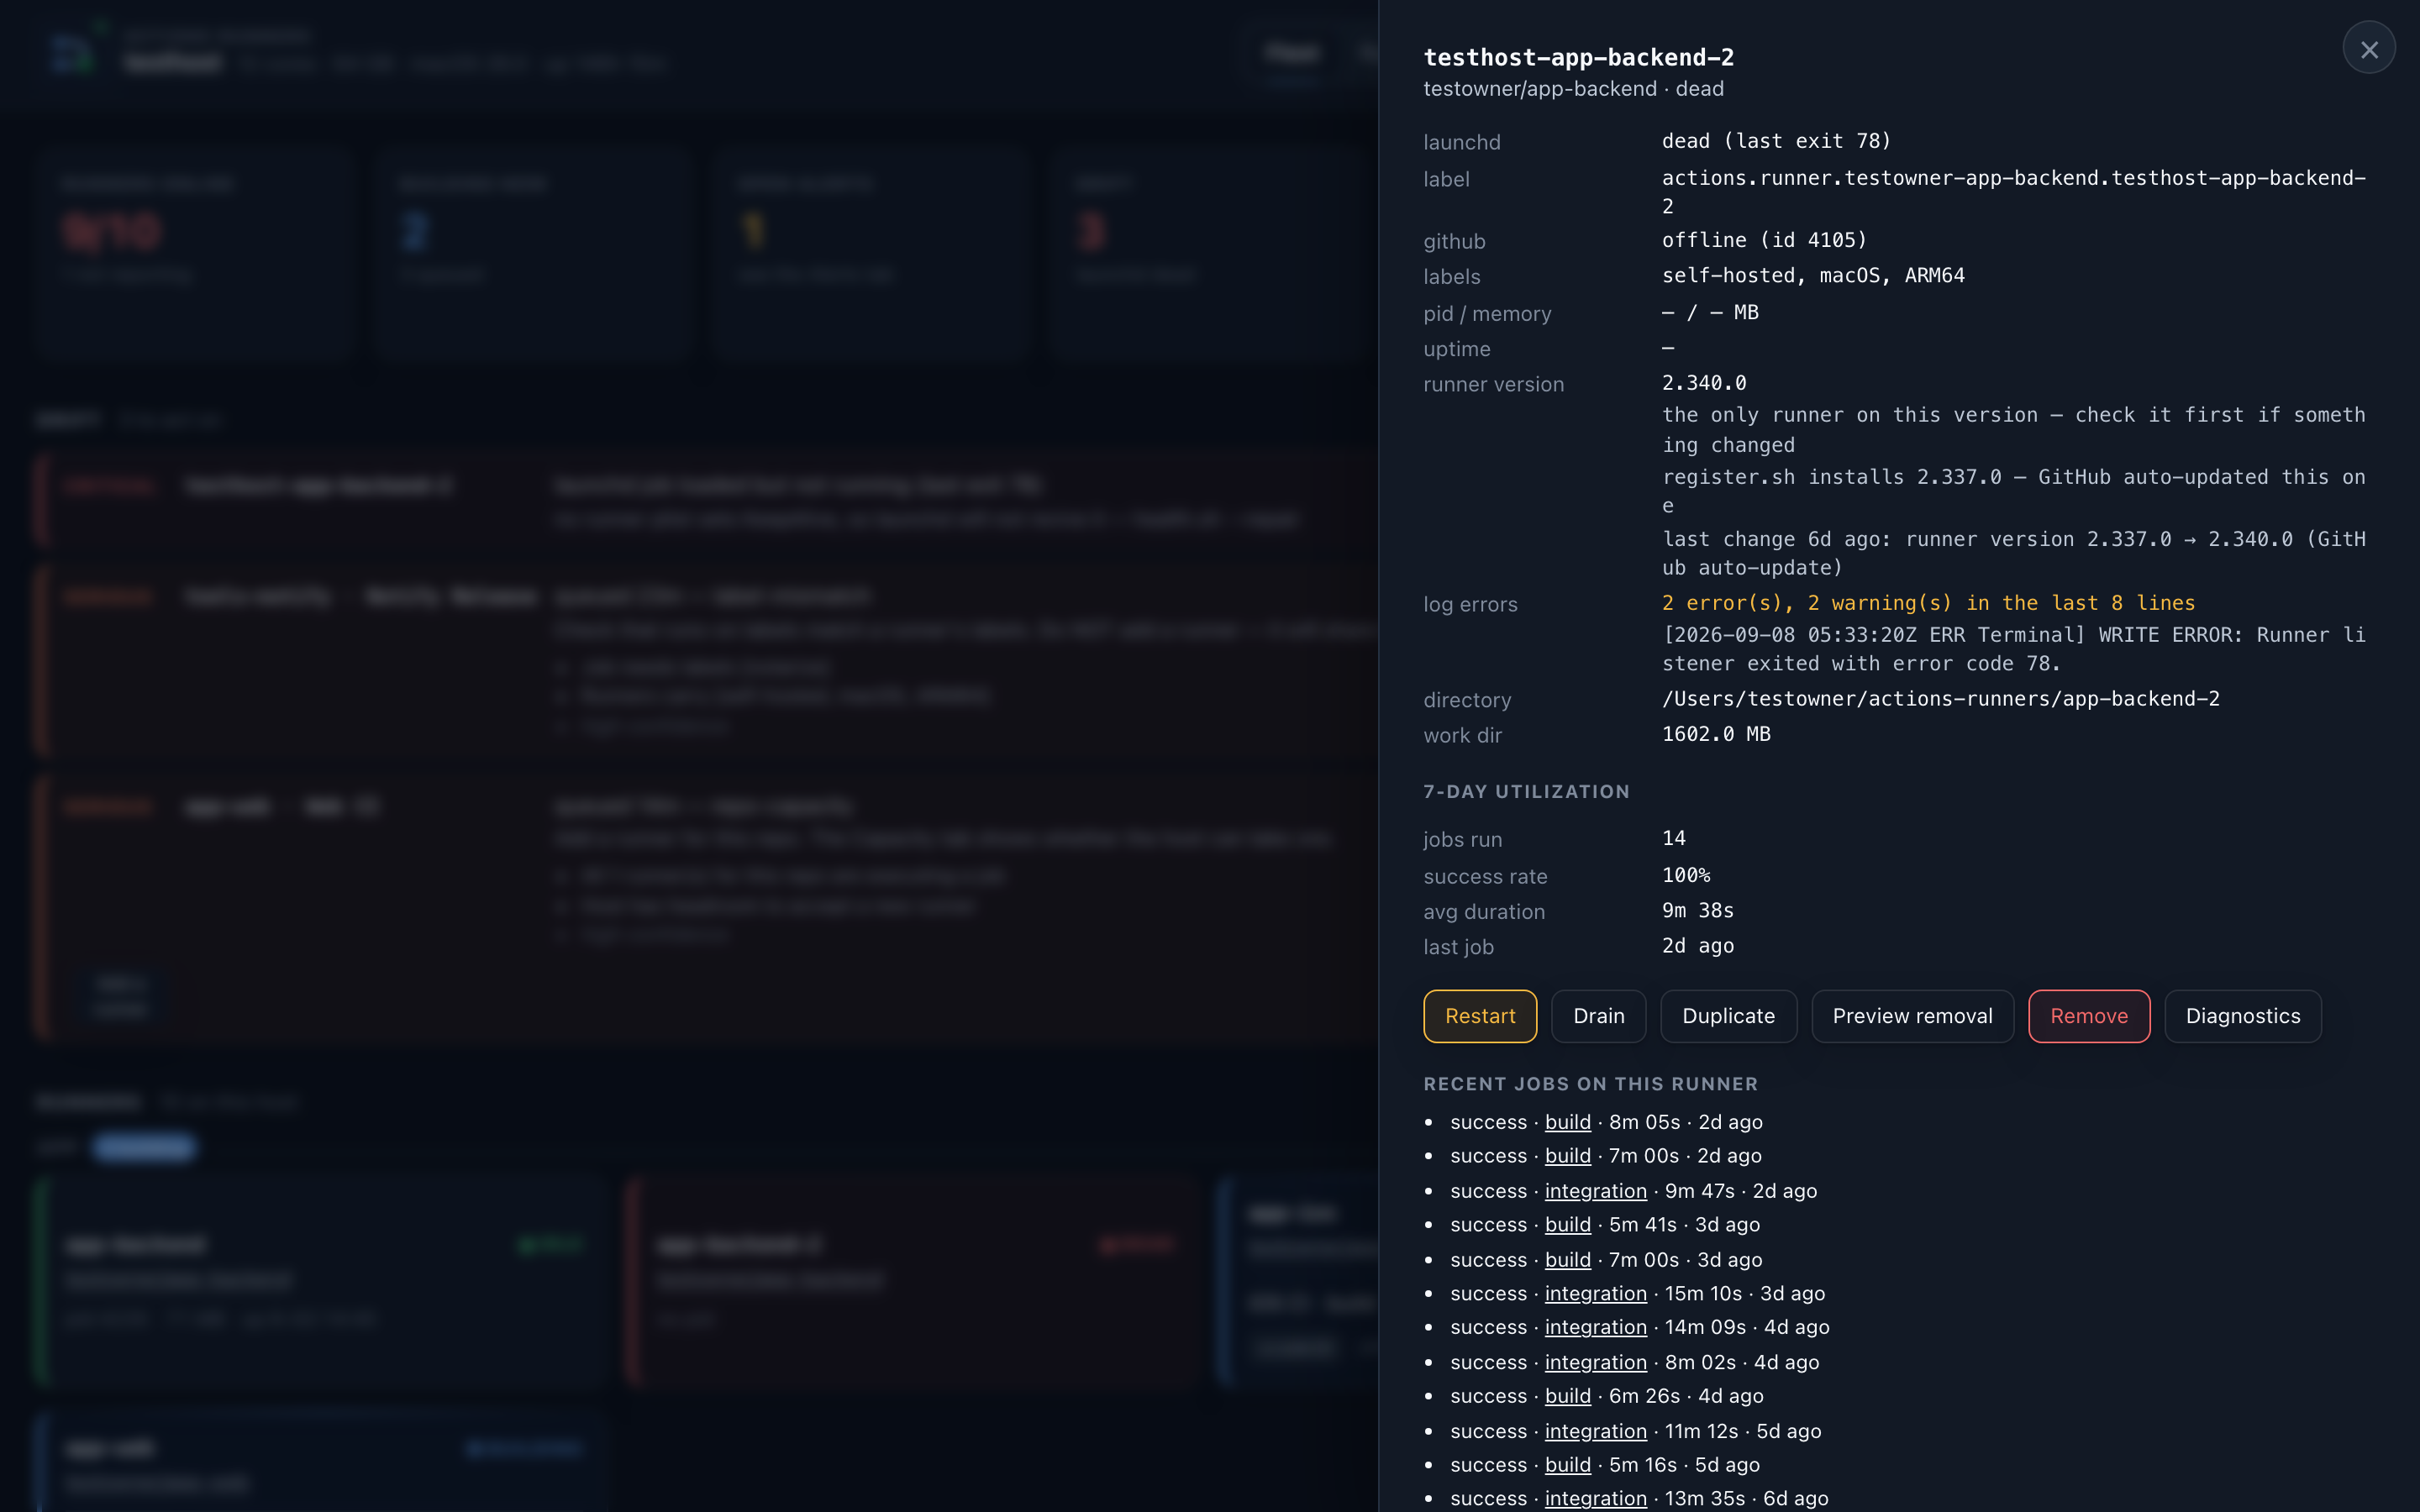
Drift alerts appear under a runner when the local and GitHub states disagree — for example, the service is running but GitHub says the runner is offline, which usually means a registration that needs re-running.
Runs
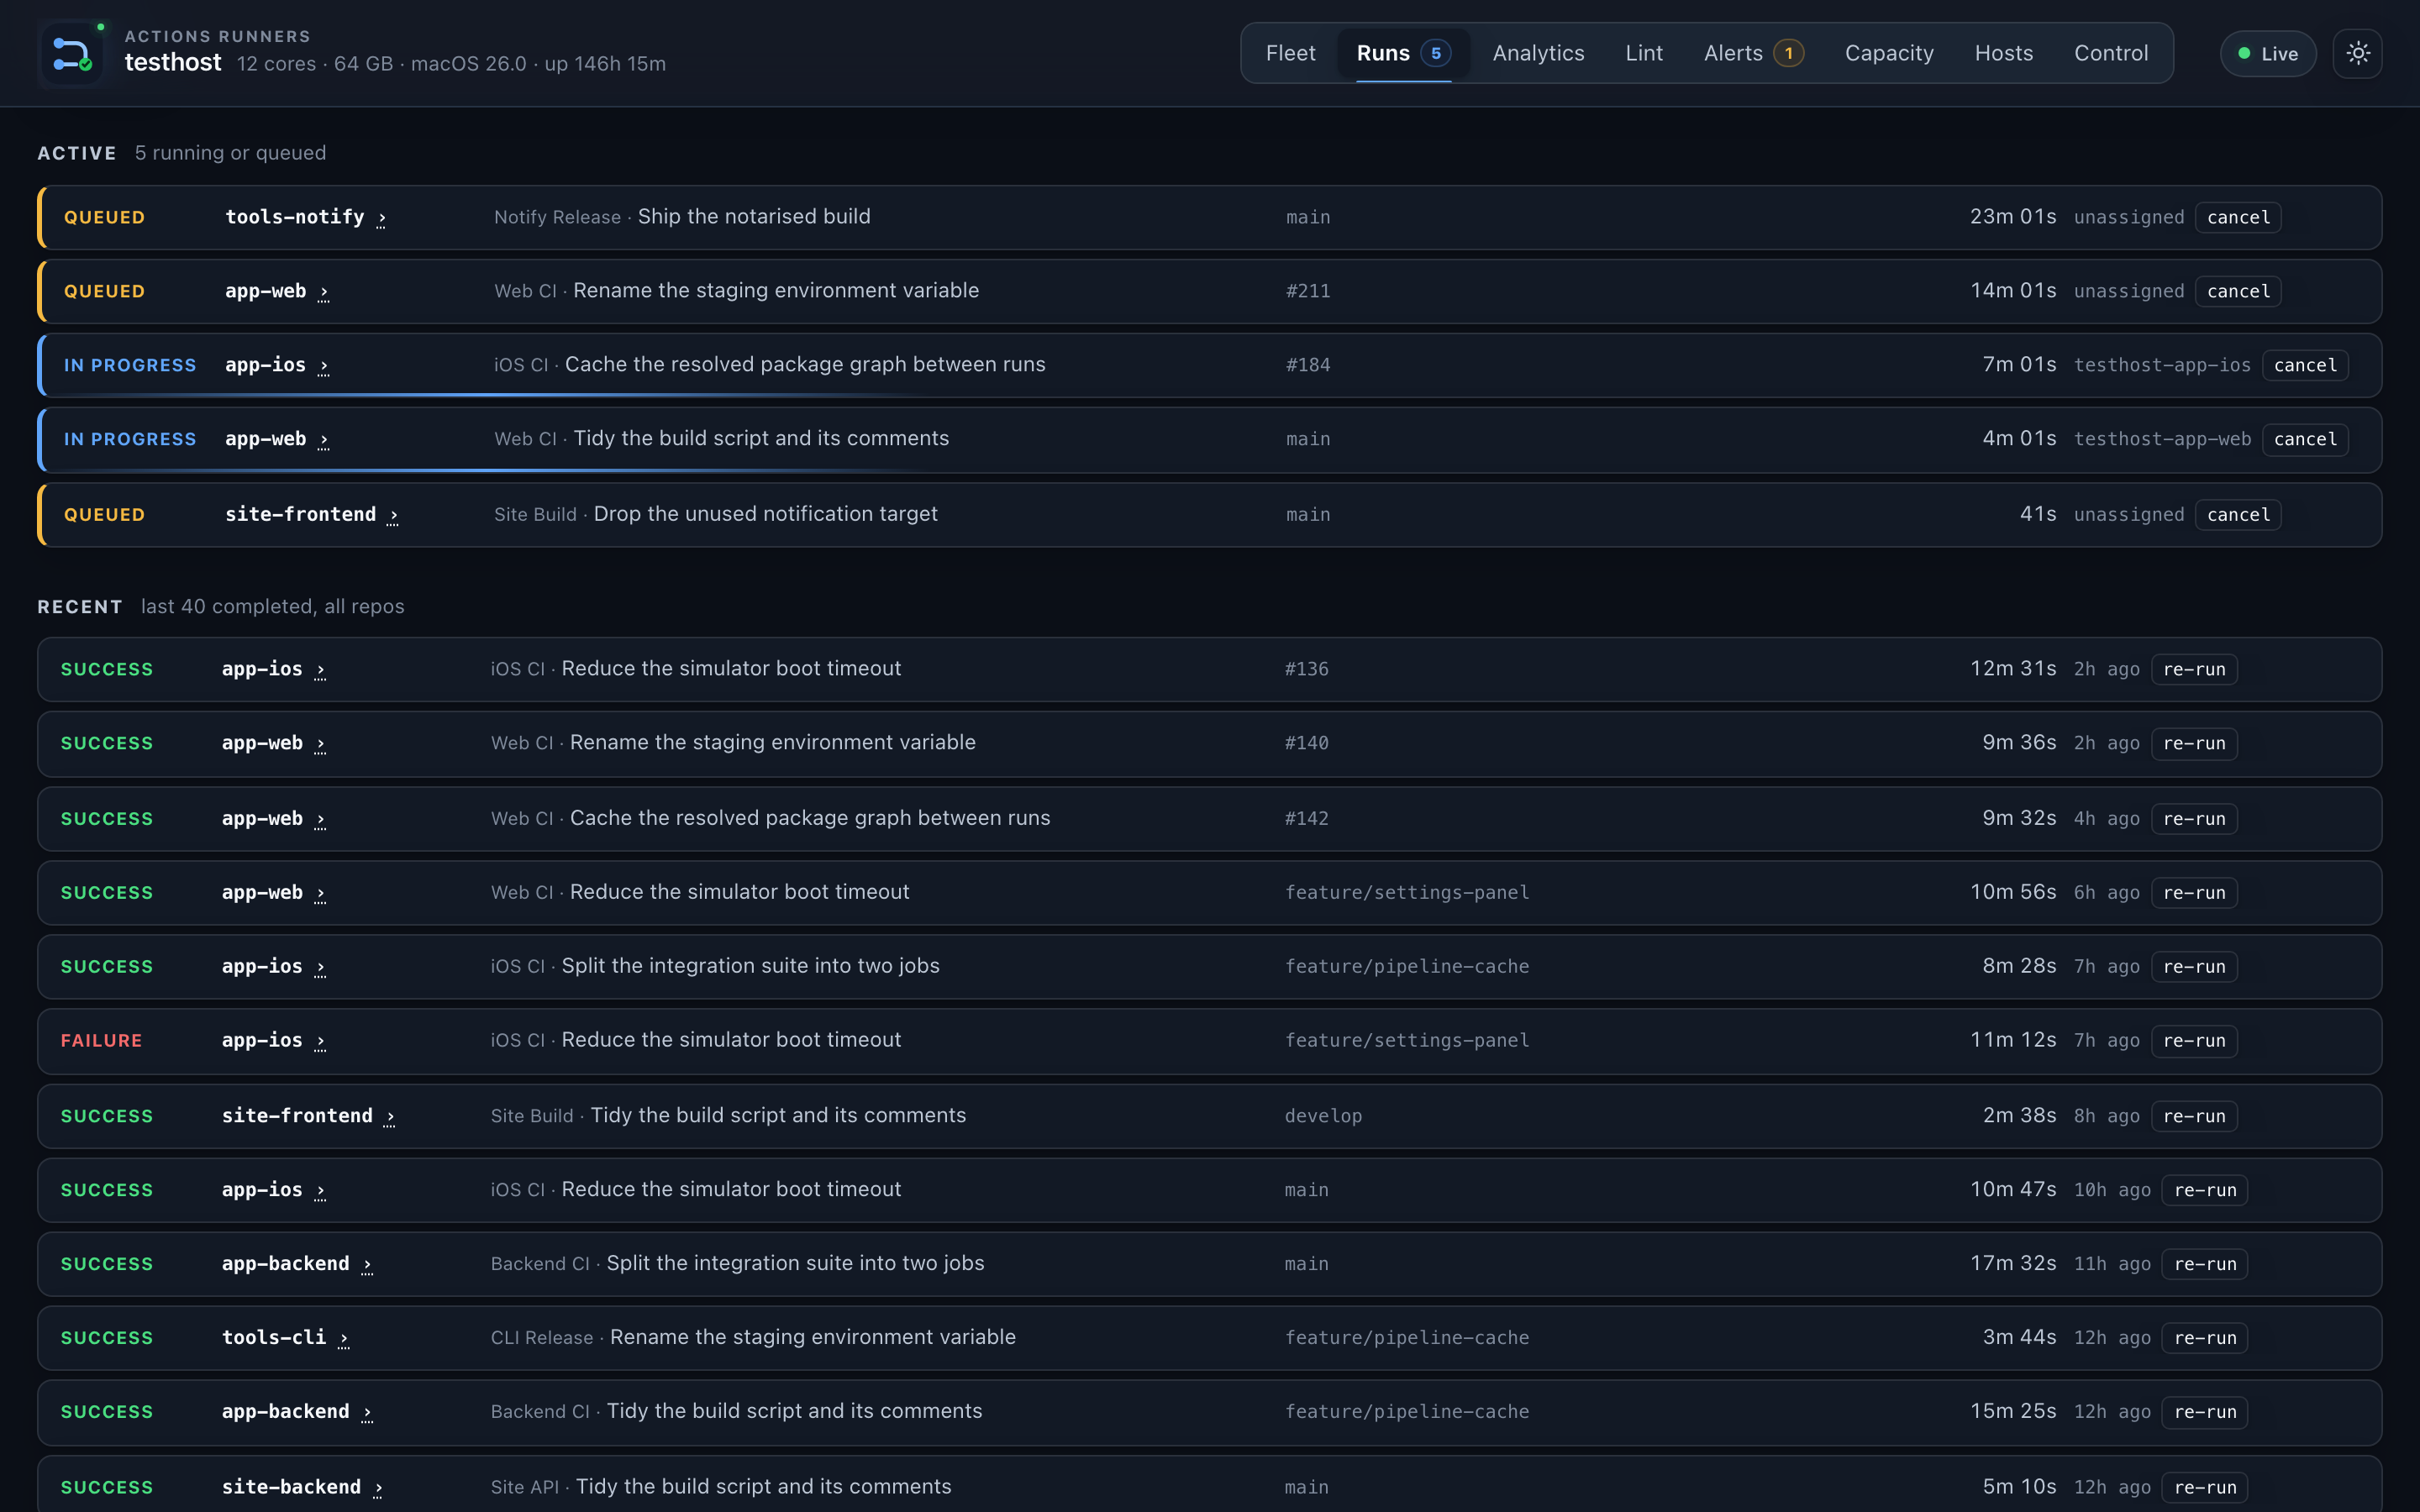
Live and recent runs across all repos. Job status, duration, and runner assignment. Click a run to open it on GitHub.
Queue diagnosis: if a job has been queued for more than a moment, the dashboard classifies why. Hover the queued indicator to see the verdict (label mismatch, no runner, runner down, host saturated, etc.) and whether the autoscaler could help.
Analytics
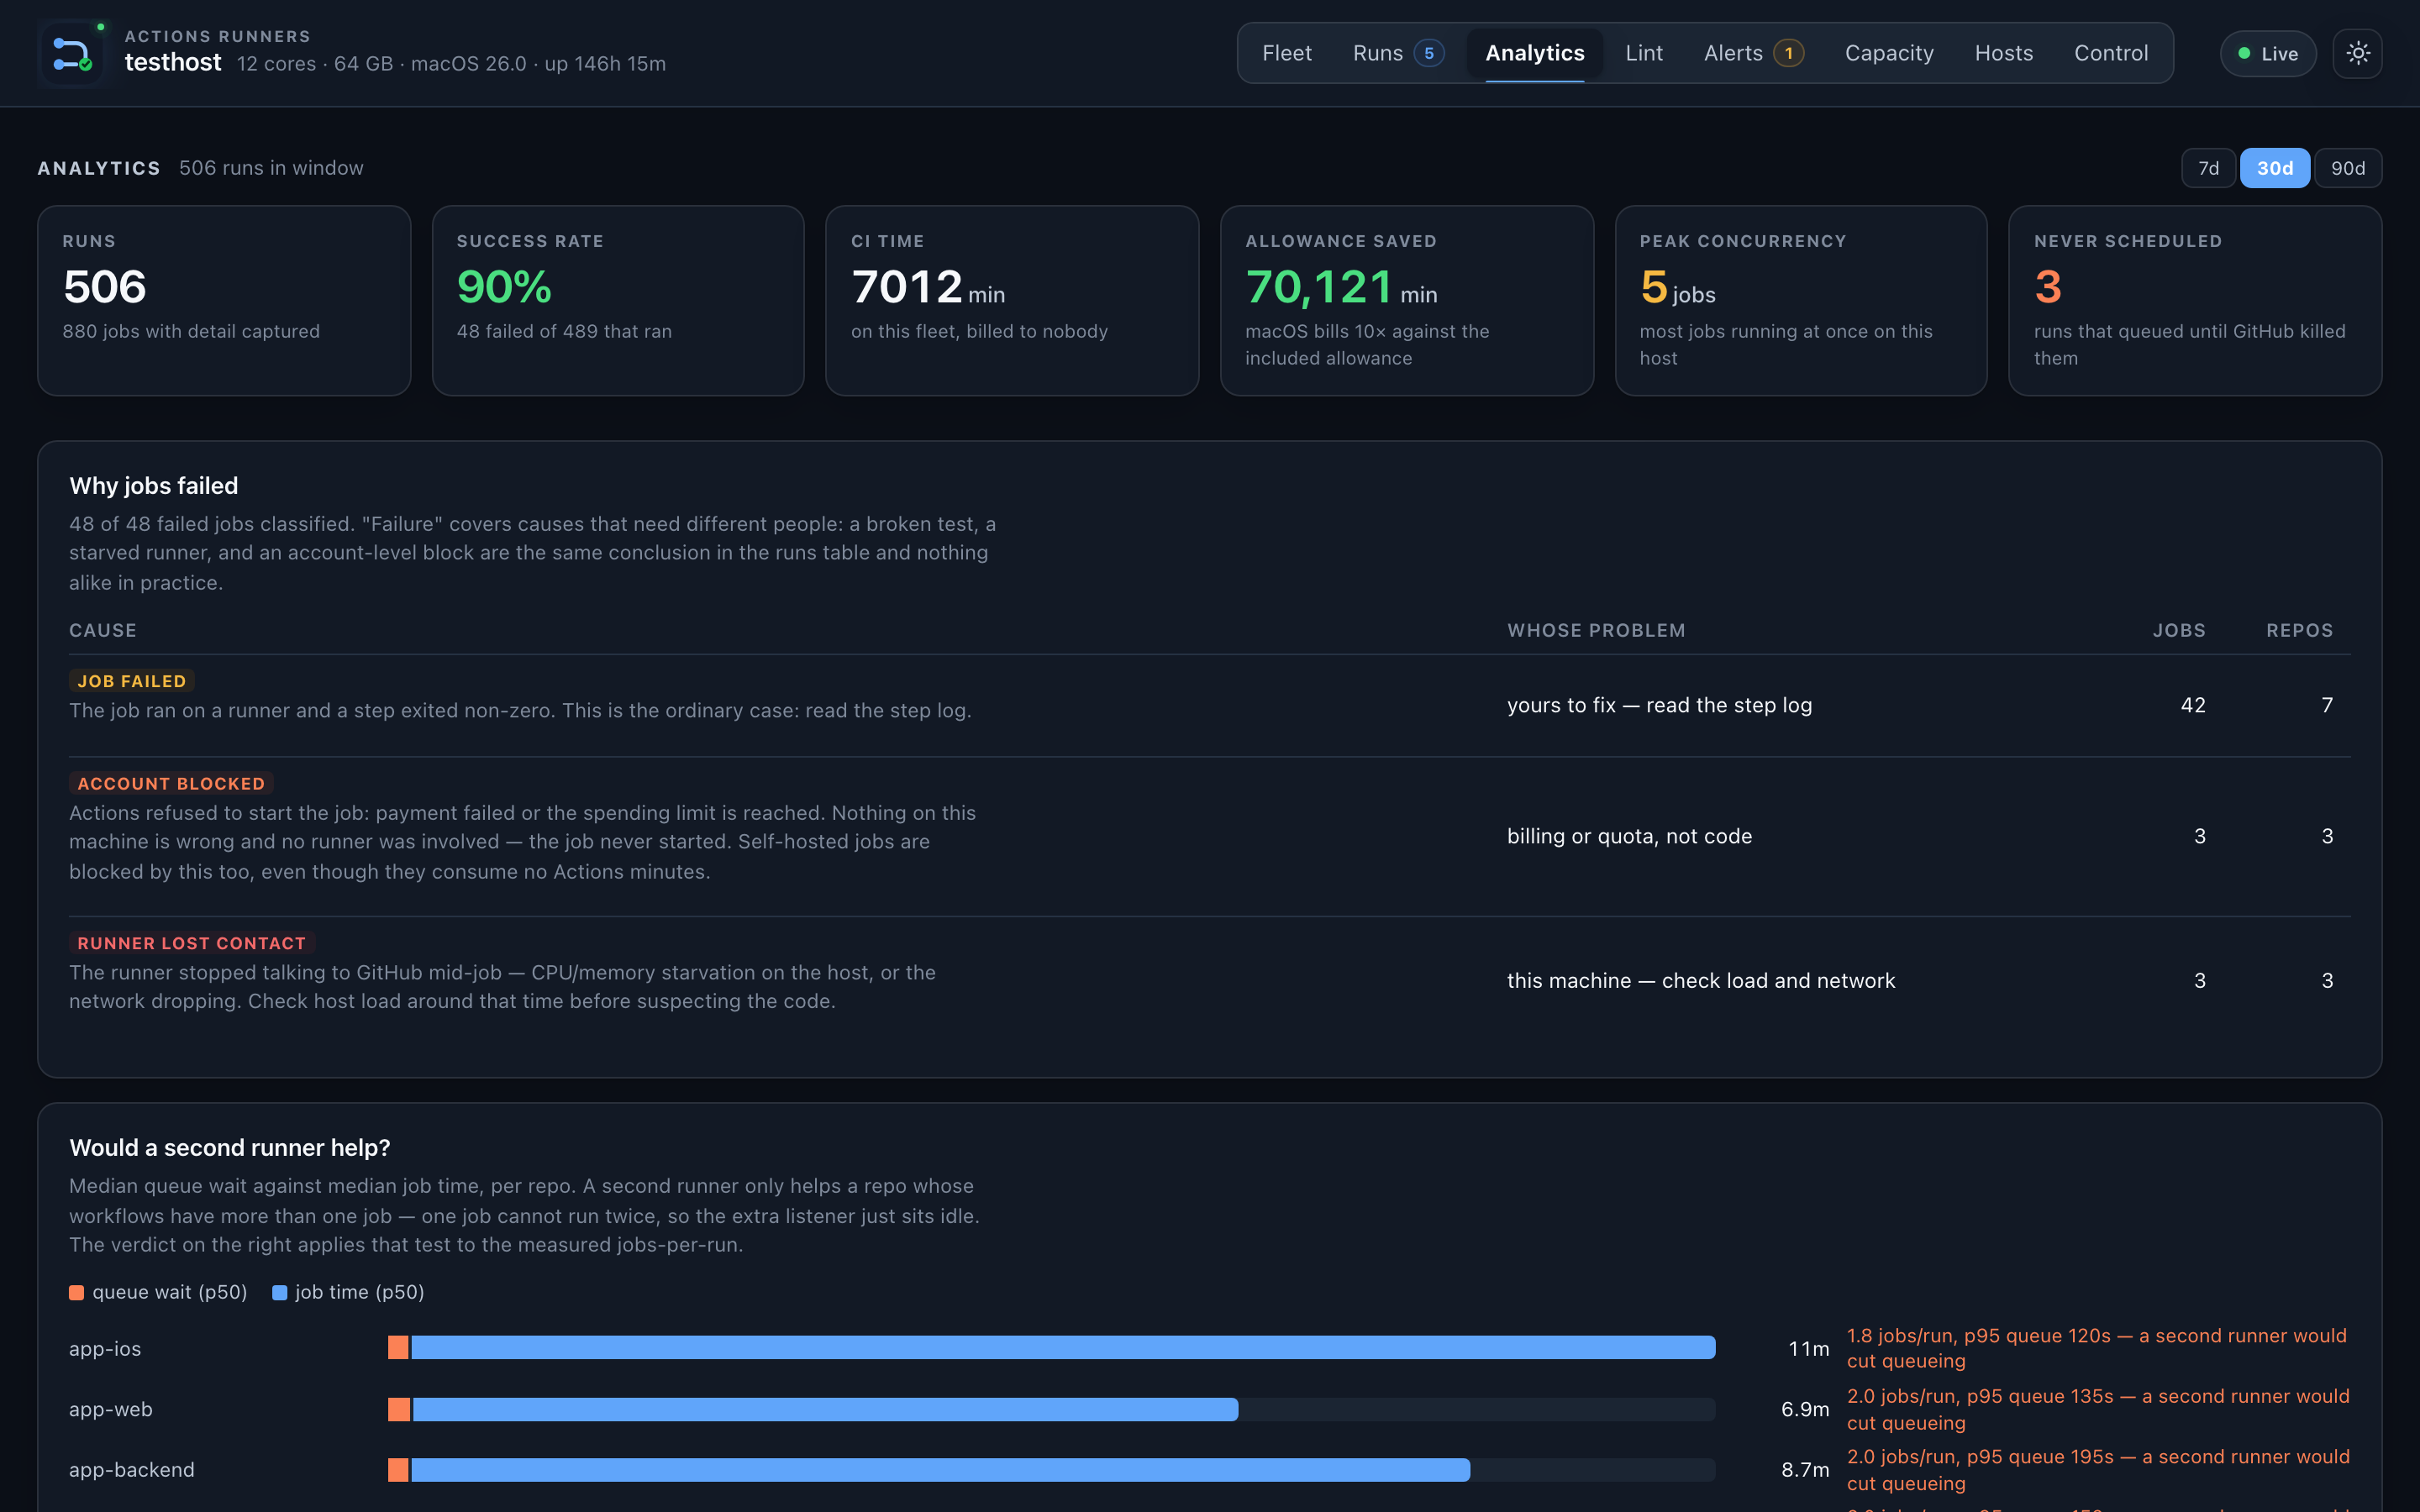
30-day job history: count, duration percentiles (p50/p95), failure rate, and runner utilisation per repo. Updated when you open the tab. Not live-streamed.
Lint
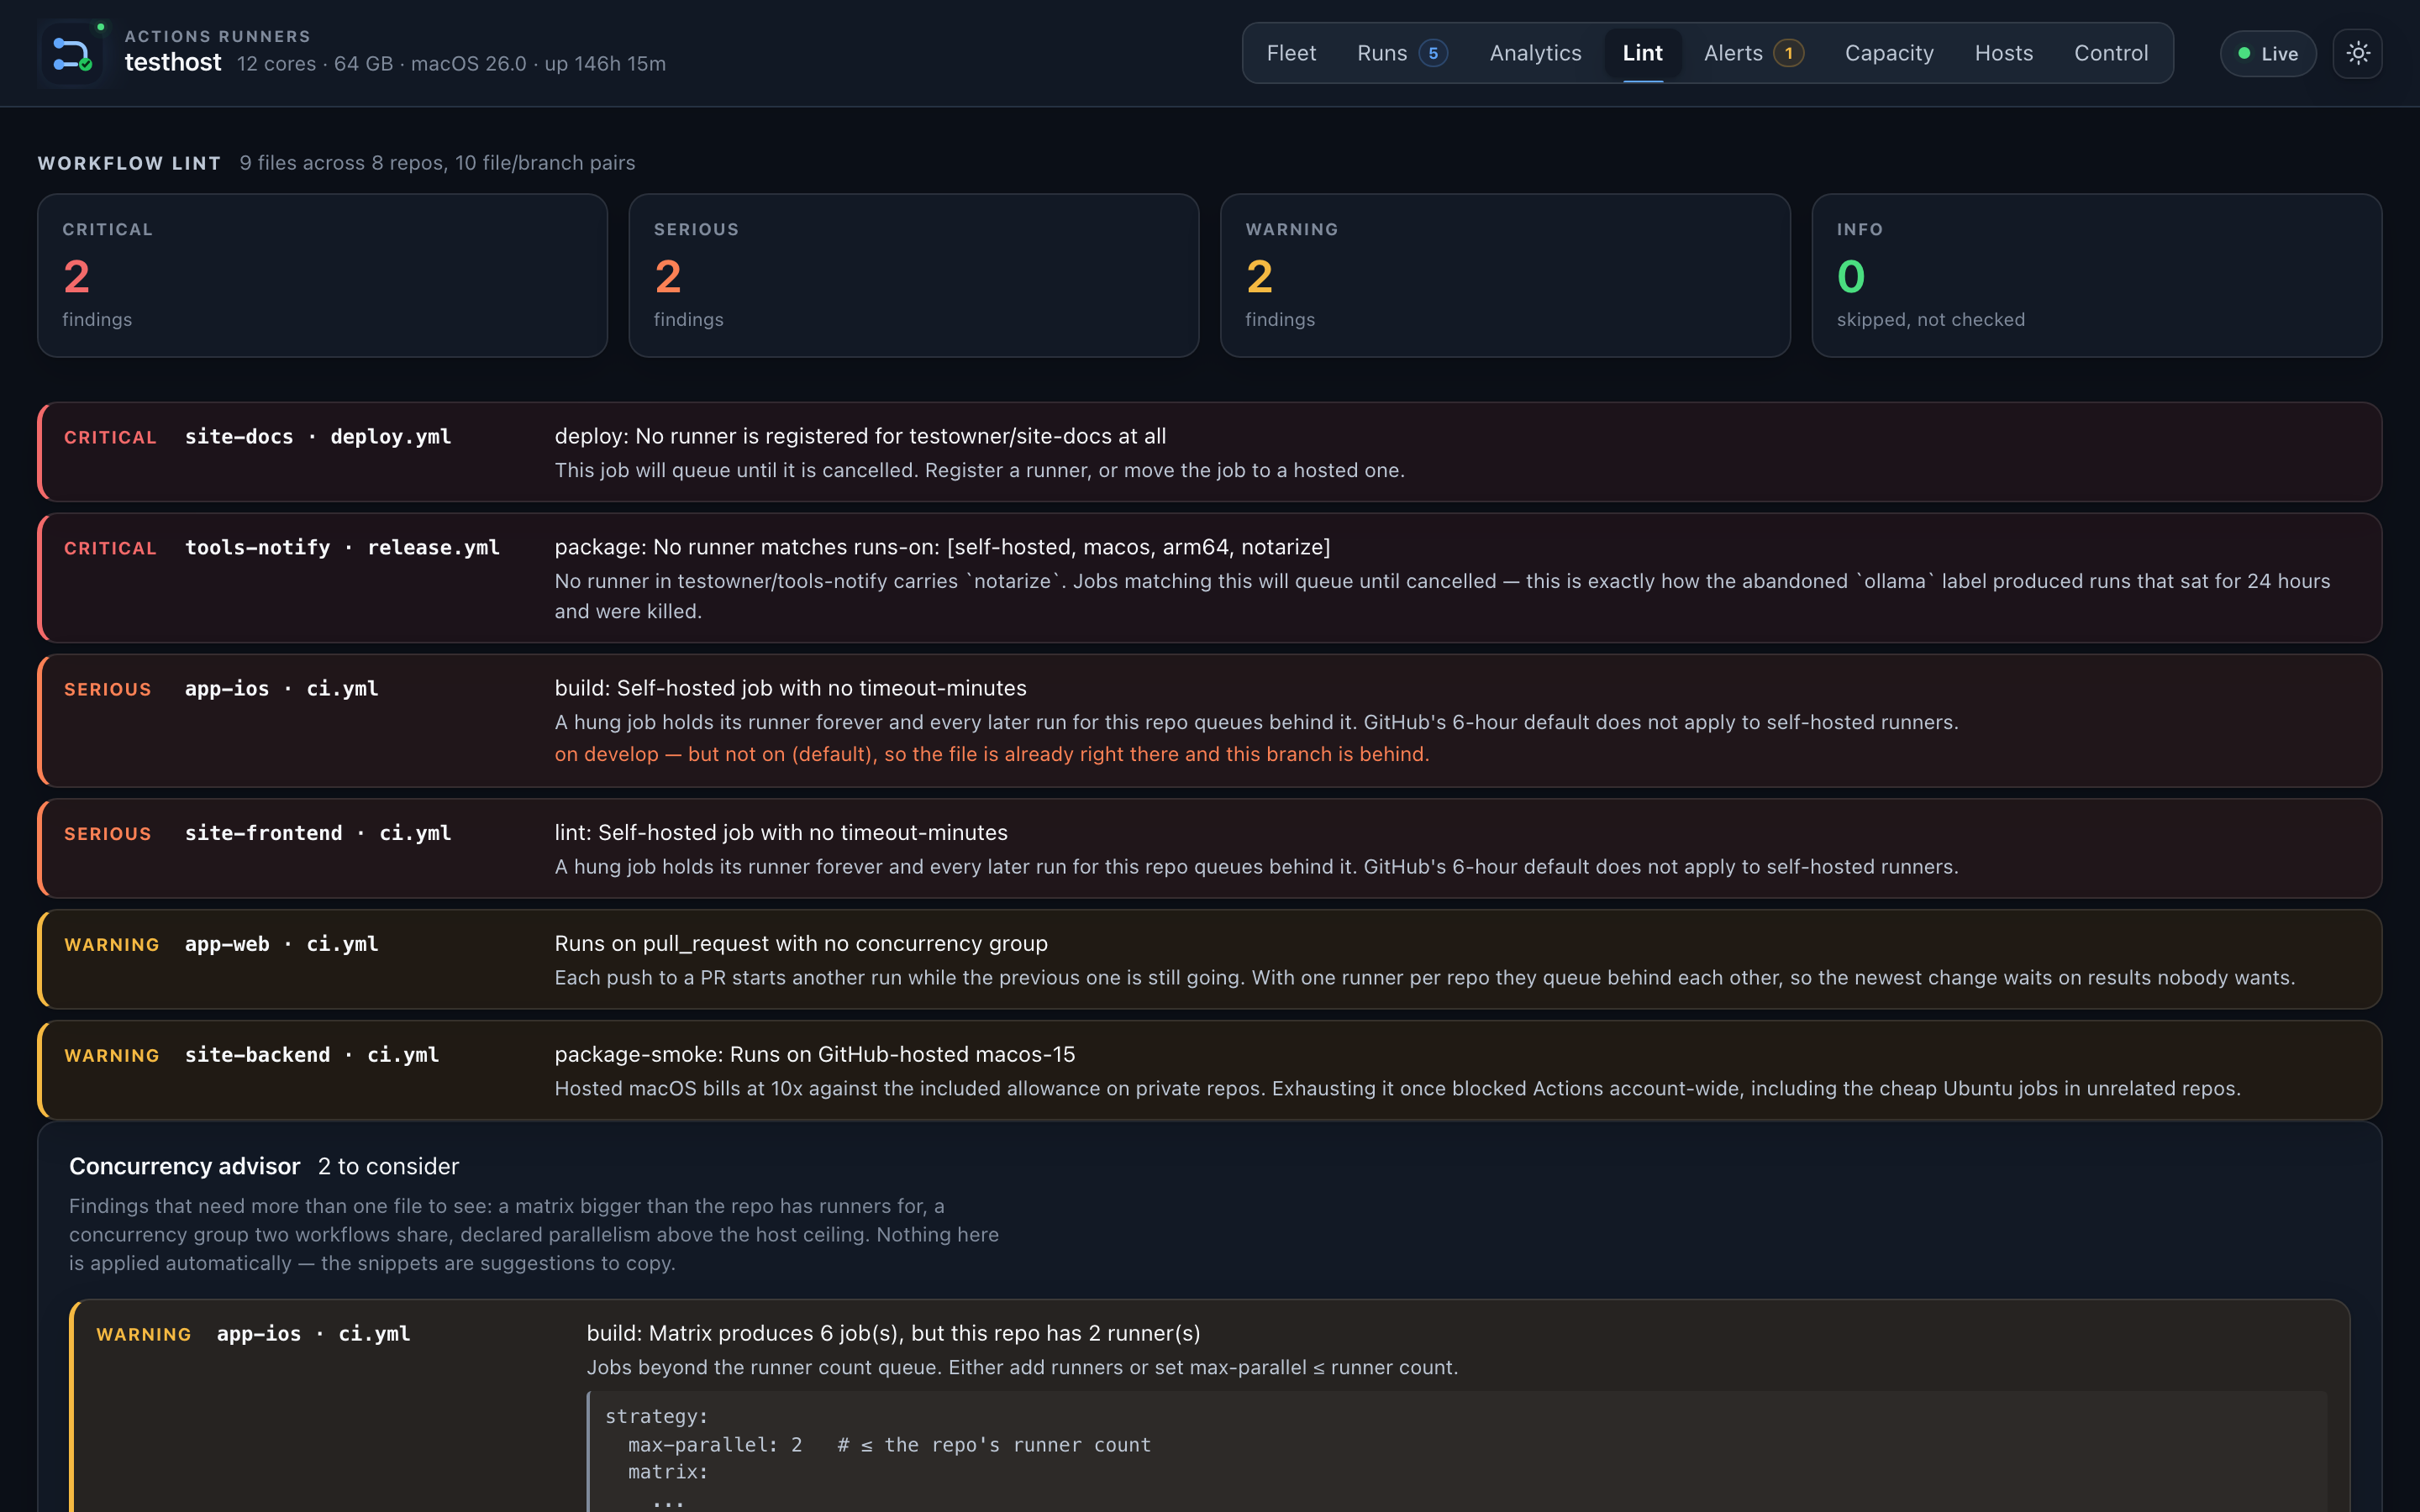
Workflow file analysis across all repos with registered runners. Flags:
- Unbounded matrix jobs (n×m runners needed)
- Missing concurrency: groups (parallel-on-push risk)
- Static concurrency group collisions (two workflows blocking each other)
- Matrix parallelism that exceeds the per-repo runner cap
Concurrency advisor findings appear here with YAML snippets showing the suggested fix.
Alerts
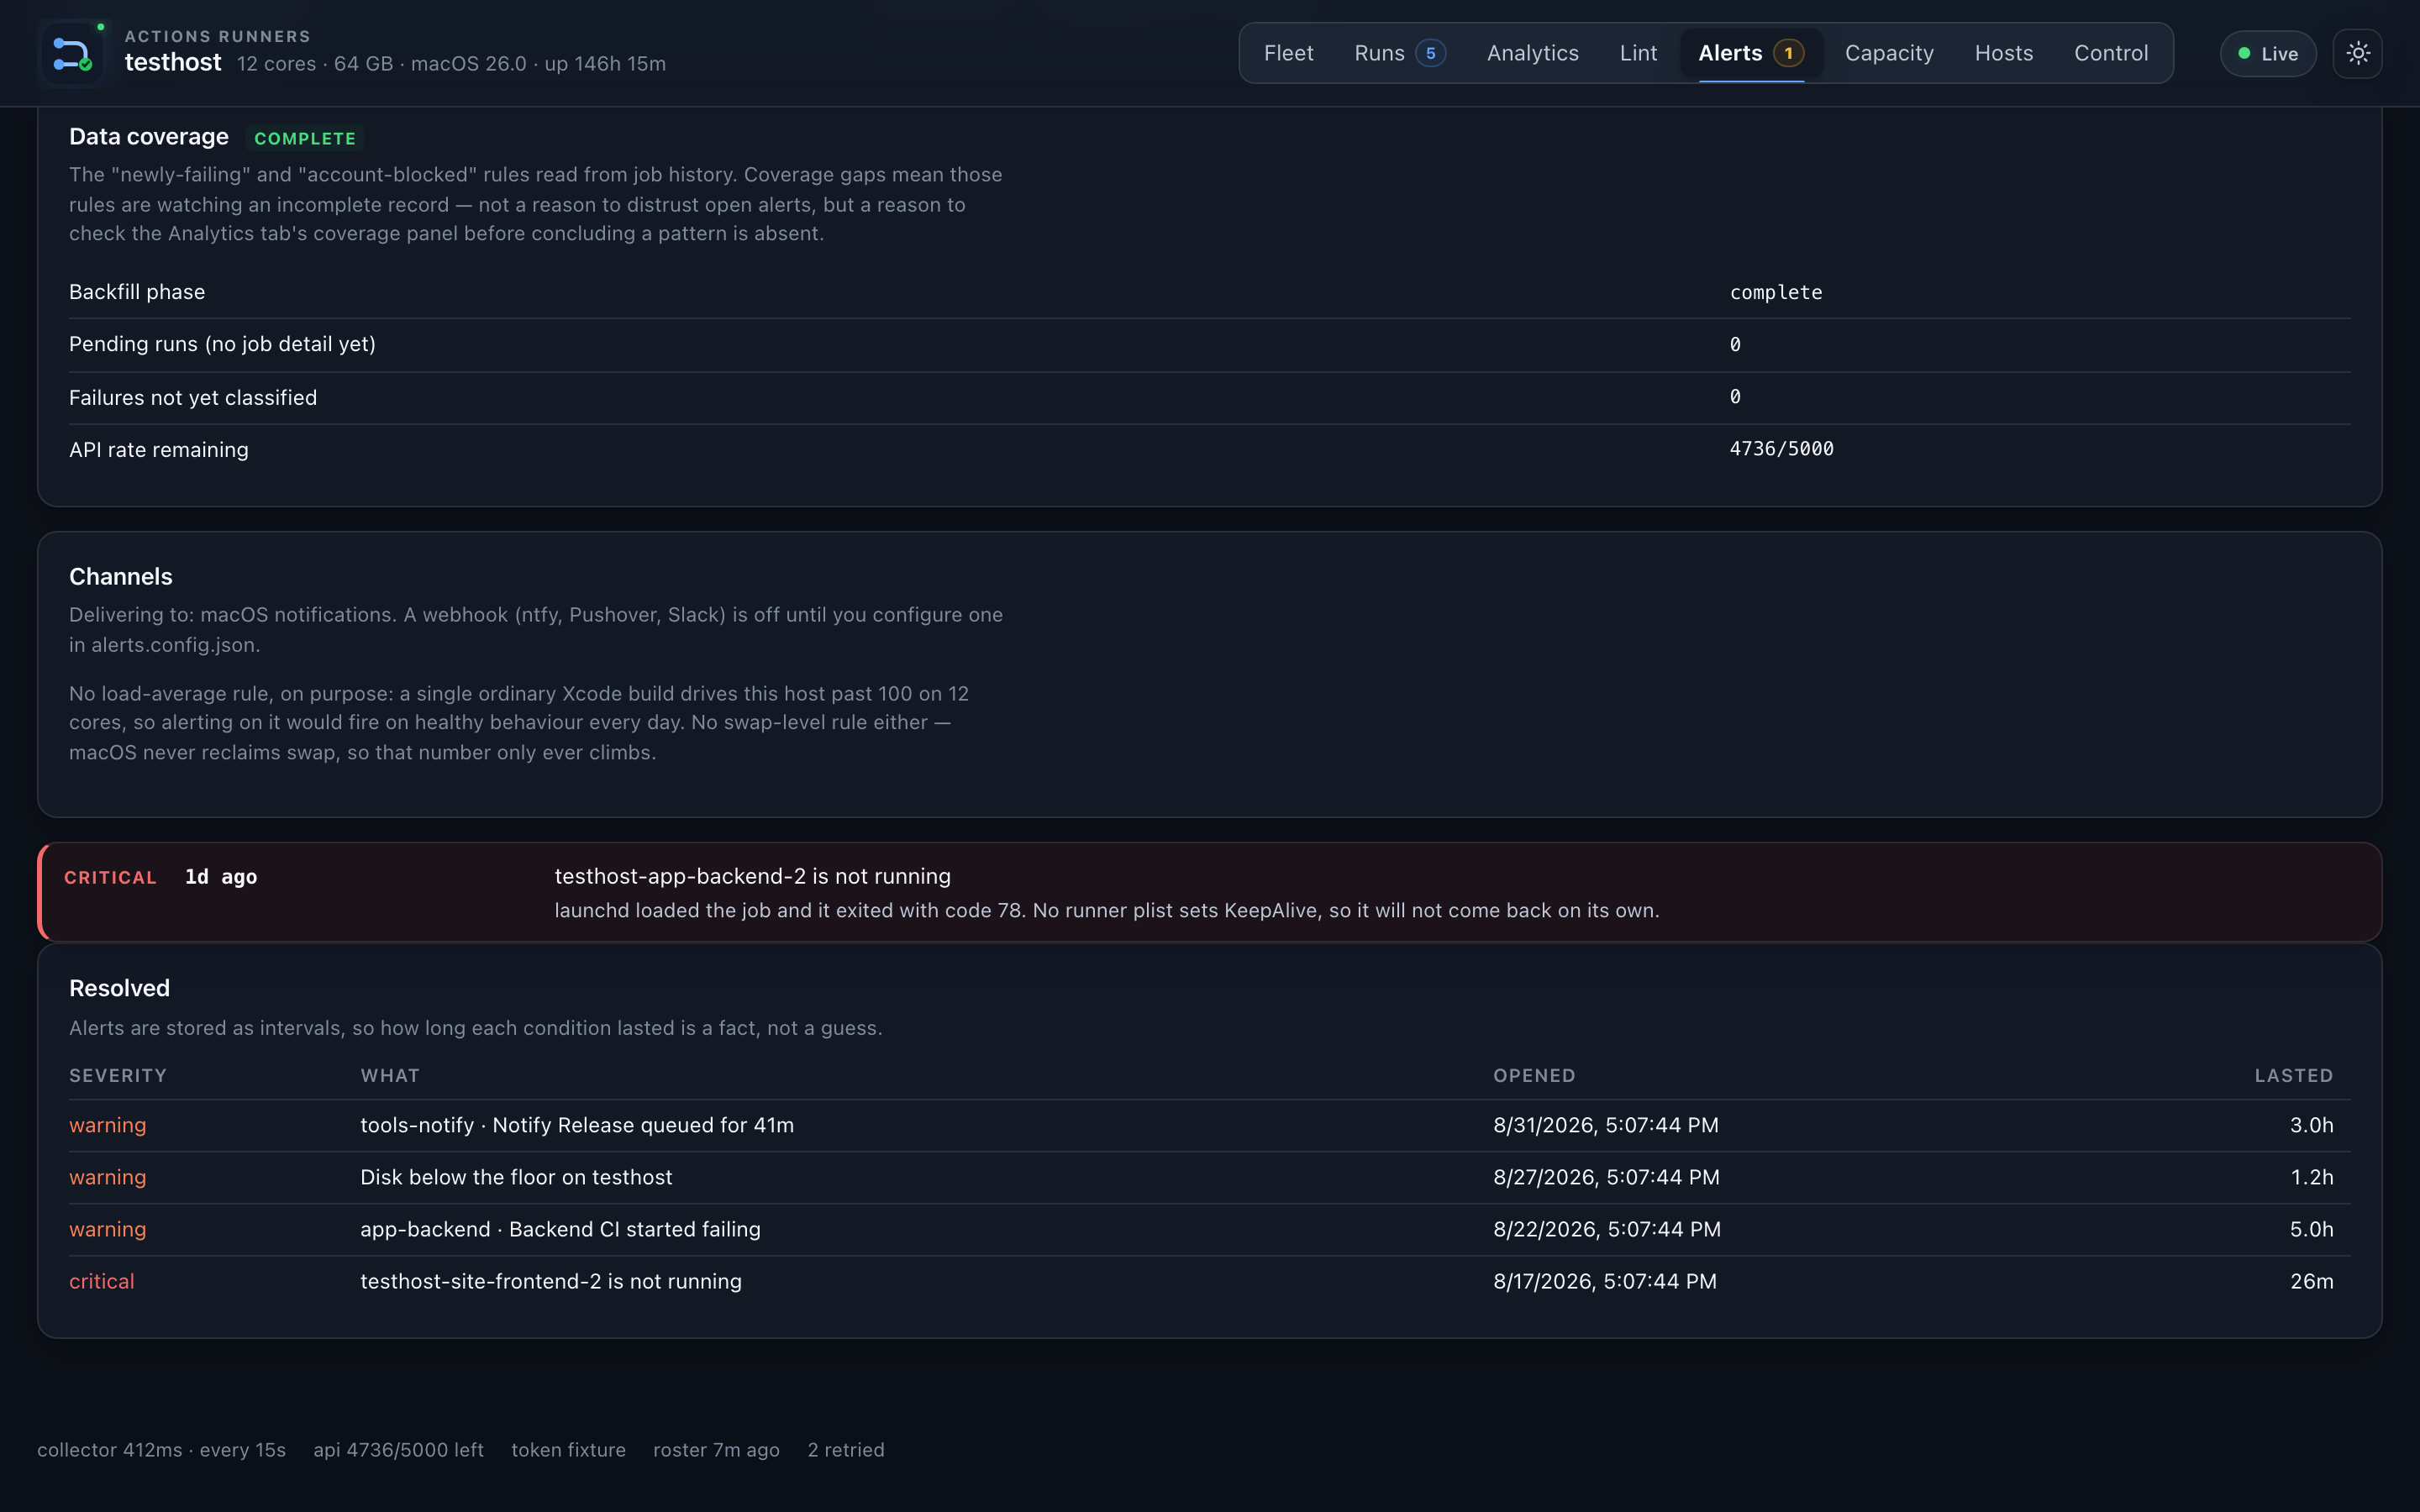
Configurable alert rules for runner offline time, queue depth, error rates,
and more. Configure in dashboard/alerts.config.json — see the example in
examples/alerts.config.json.
Capacity
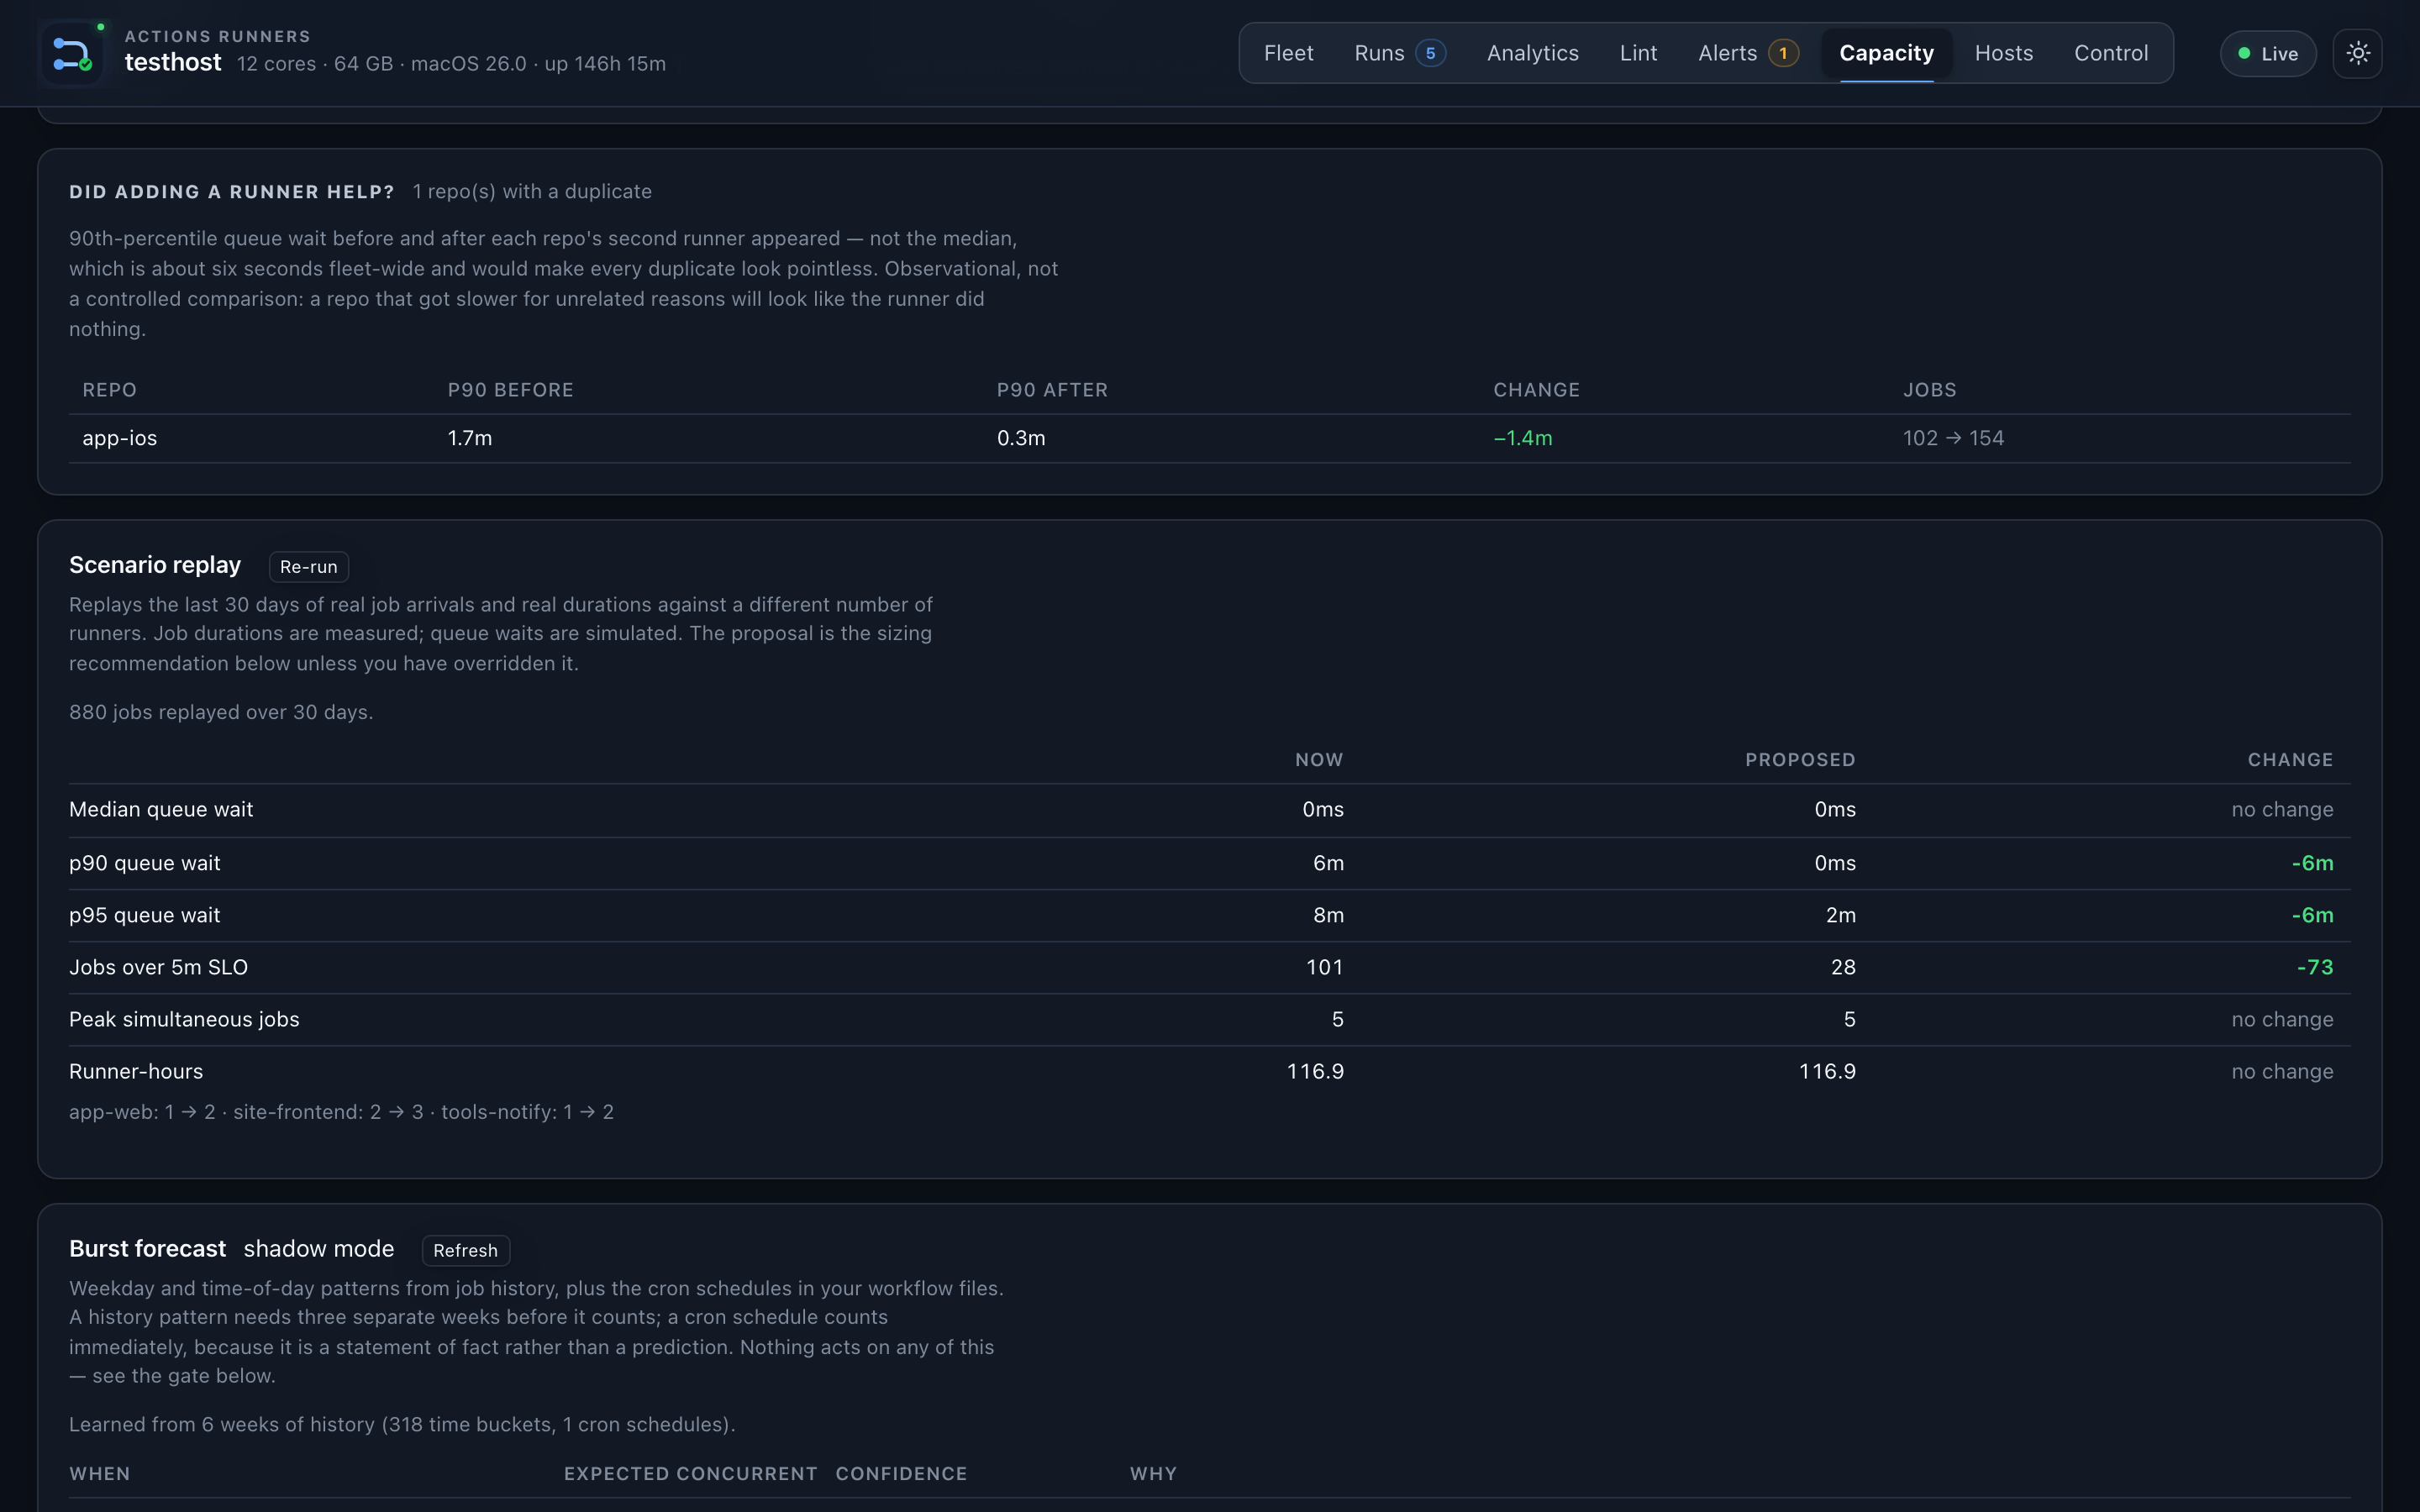
Sizing panel: shows the recommended runner count for each repo based on observed peak concurrent jobs. Toggle autoscaling on/off here.
Admission panel: shows the current FLEET_ADMIT_MODE and a history of
held/admitted decisions if observe or enforce mode is active.
Scenario replay: run "what if we had N runners for repo X" against actual historical job data. Shows queue wait p95, max queue depth, and SLO compliance.
Burst forecast: next-hour demand estimate based on weekday/time-of-day patterns and workflow schedules. Shadow-only — verifies accuracy against reality before any action is taken.
Control
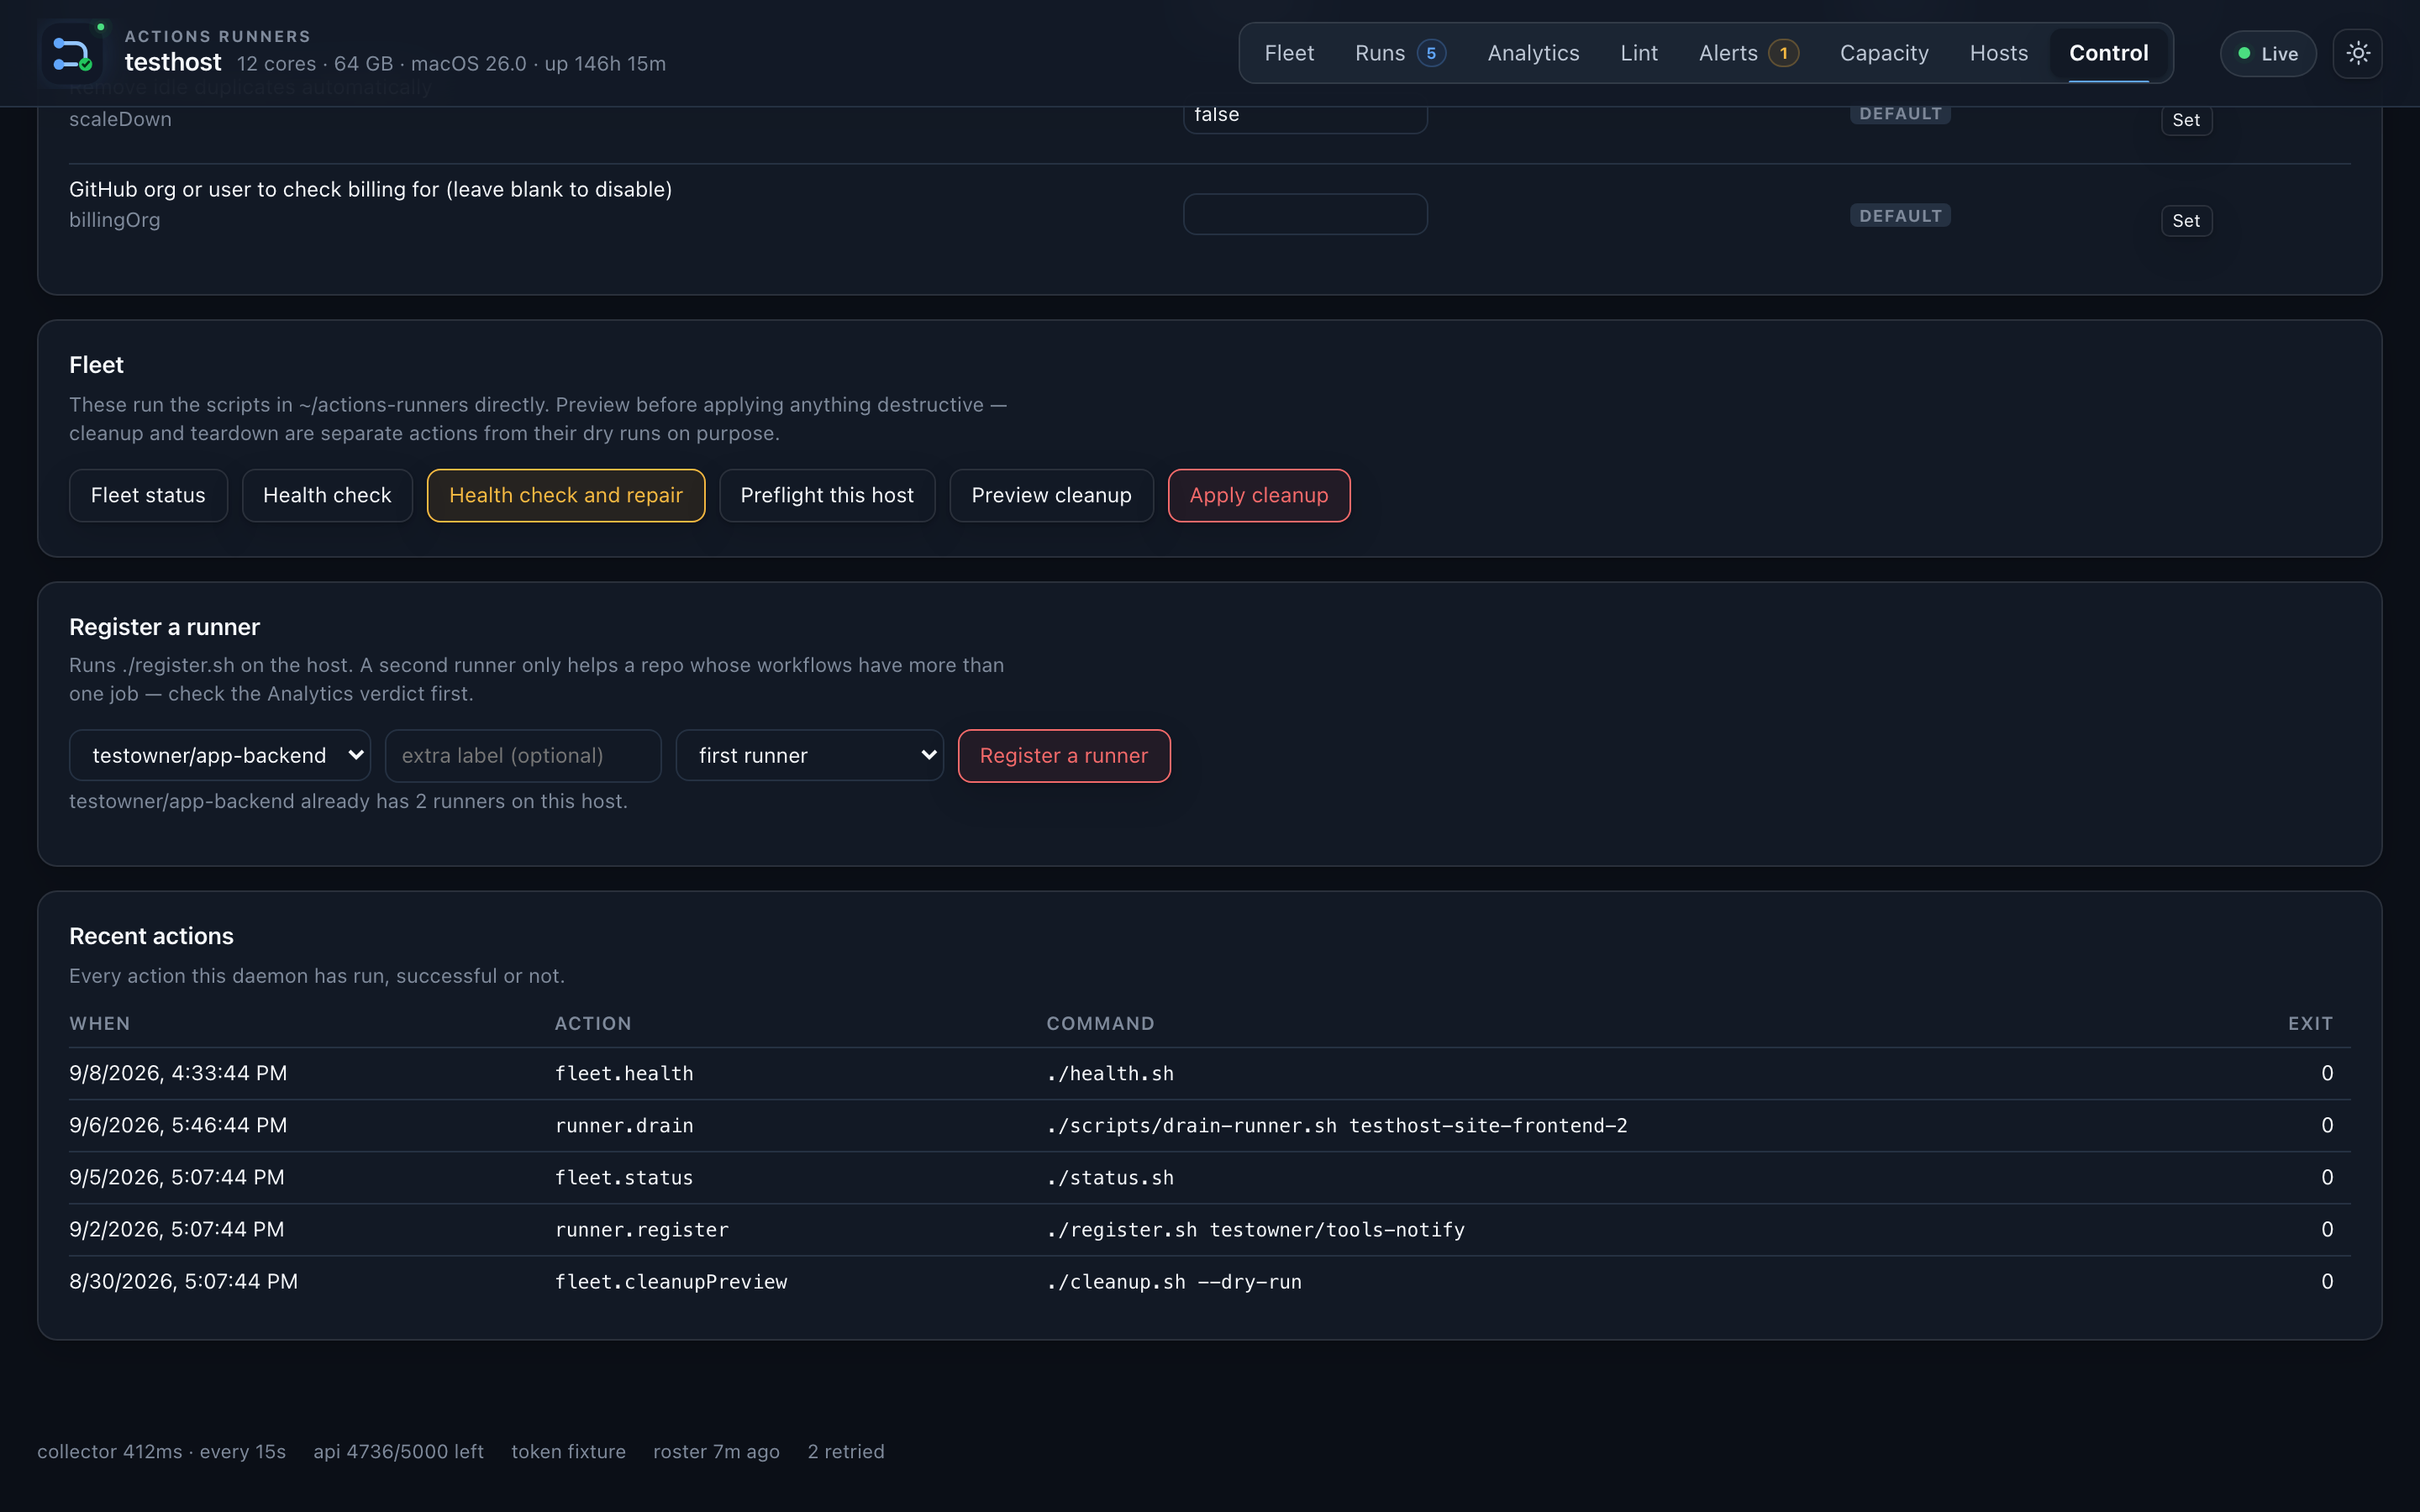
Manual actions: duplicate a runner, deregister one, drain/resume, run a health
check. Every action requires the bearer token (paste once; stored in
localStorage). Dangerous actions show a confirmation dialog.
Action log at the bottom of the page shows the stdout of the last executed action.
Hosts
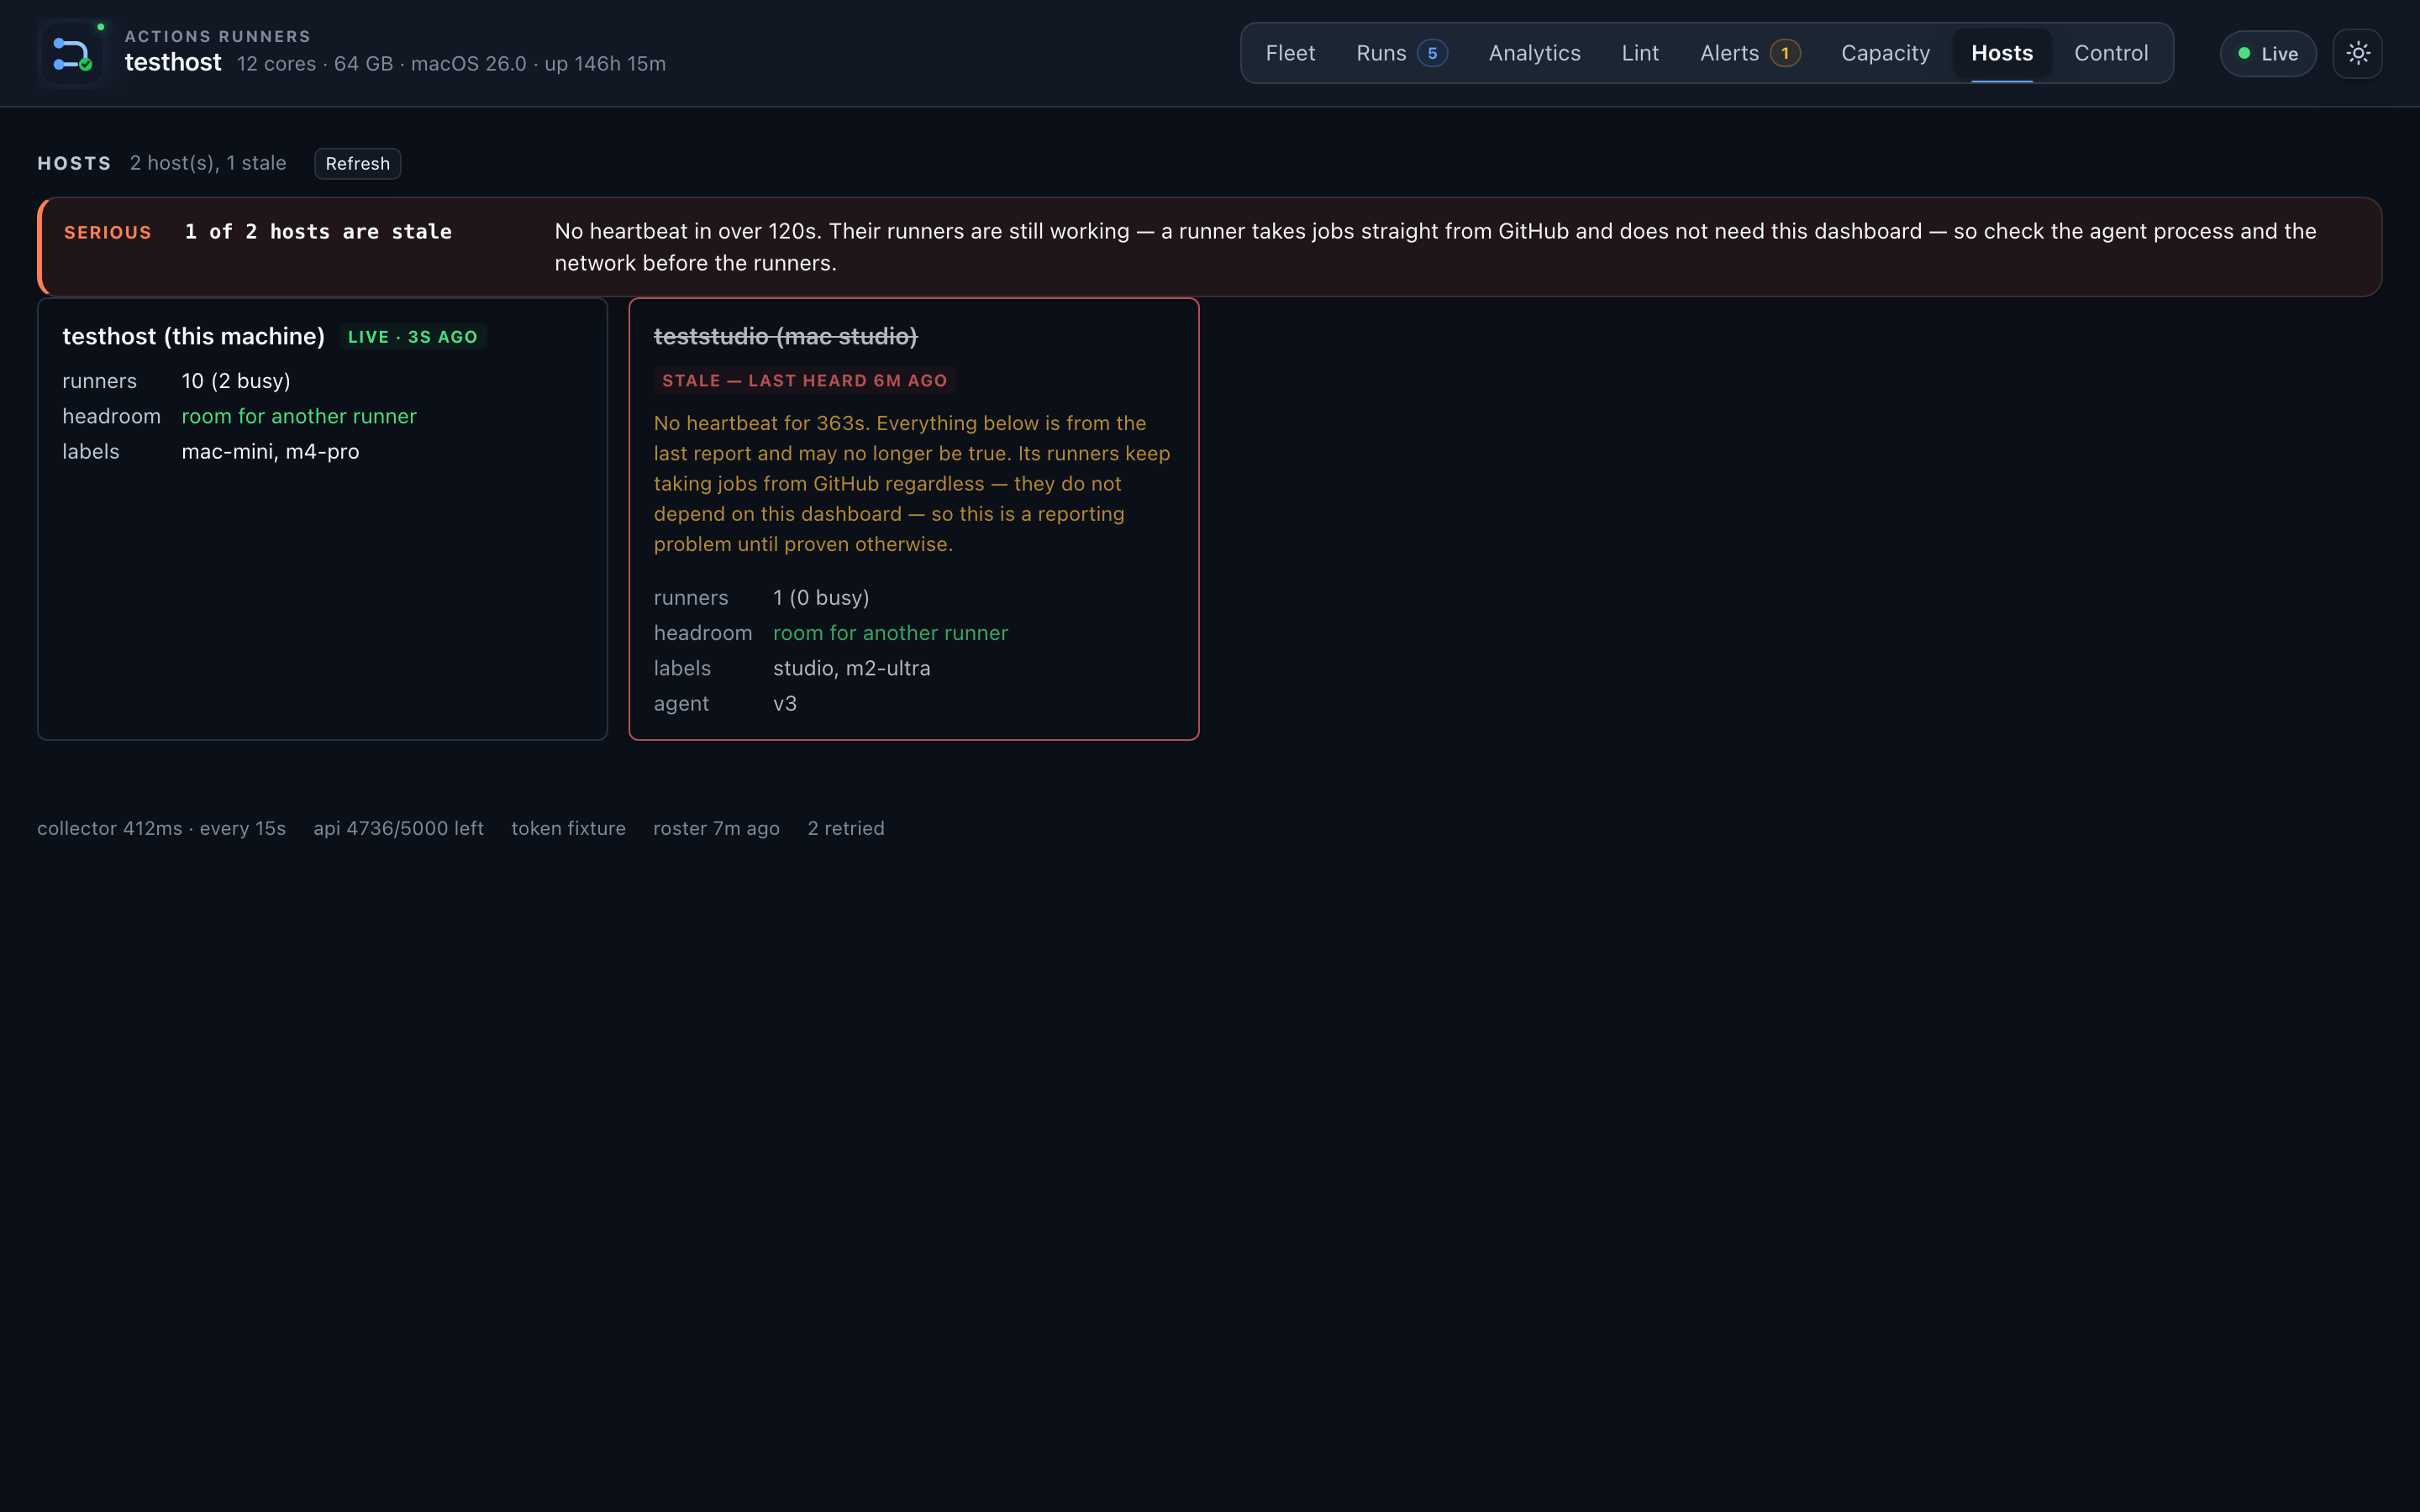
Federated host view (when agents are configured). Shows each remote Mac's runners, load, disk, and drain state. A host whose heartbeat is stale (>2 minutes old) is flagged in orange.
Queue diagnosis causes
| Cause | Meaning | Autoscale eligible? |
|---|---|---|
telemetry-unavailable |
GitHub or the local probes failed, so nothing here is trustworthy | No |
unserved |
No runner registered for this repo | No |
label-mismatch |
No runner has all required labels | No |
runner-down |
All runners for this repo are offline/drained | No |
concurrency-block |
Another job from this run is using the only runner | No |
host-saturation |
No runner is free and the headroom gate is refusing additions | No |
repo-capacity |
More jobs than runners for this repo | Yes |
github-delay |
Runner is ready but GitHub has not dispatched | No |
Only repo-capacity with high confidence triggers autoscale. A label mismatch
would only be made worse by cloning the existing runner.
Why a job is queued explains what each cause rules out, and Honest analytics explains how they are recorded.
Actions
All actions require the control token in an Authorization: Bearer header. The
browser stores this token in localStorage after you paste it once.
| Action | Effect | Requires confirmation? |
|---|---|---|
| Duplicate runner | register.sh with same labels + RUNNER_INSTANCE=N+1 |
Yes |
| Drain runner | scripts/drain-runner.sh --drain |
Yes |
| Resume runner | scripts/drain-runner.sh --resume |
Yes |
| Deregister runner | scripts/deregister.sh --apply |
Yes |
| Health check | ./health.sh |
No |
| Download diagnostics | Redacted bundle (token-gated) | No |
Autoscaling
The autoscaler adds runners when the queue classifier returns repo-capacity
with high confidence, and removes idle duplicates that have been idle longer
than the configured TTL.
Toggle and configure from the Capacity tab. dry-run mode logs decisions
without executing them — run there first.
The autoscaler never touches the instance-1 runner for any repo (it would remove the last runner, which is never the right outcome).
See Admission and Scaling for the full policy.
Diagnostic bundles
The runner drawer's Diagnostics button downloads a redacted plaintext bundle containing the runner's configuration, recent events, job history, and log summary. The bundle uses an allowlist — only named files are included, and every line is passed through the secret redactor. Safe to paste into an issue.
The download requires the control token.
Read-only mode
FLEET_READ_ONLY=1 disables the control plane entirely. The dashboard is
still live-updating, all read routes still work, and no bearer token exists. Use
this for a LAN-accessible read-only status board where you want to bind to
0.0.0.0 without granting any write access.
Security note
Read routes are unauthenticated by design on loopback. This is appropriate for
the default deployment (dashboard on localhost, accessed via SSH tunnel) but
means that anything on the same machine with localhost access can read runner
status, job history, and diagnostic log tails. See Security
Hardening for LAN deployment guidance.